Bill got me most of the 2023 brivo data, it was cutoff at early November apparently due to hitting the 64k records in an excel worksheet.
The graphs aren’t surprising, here are some quick stats for Jan-Nov 2023
514 badges counted, the average member entered A^2 126 times
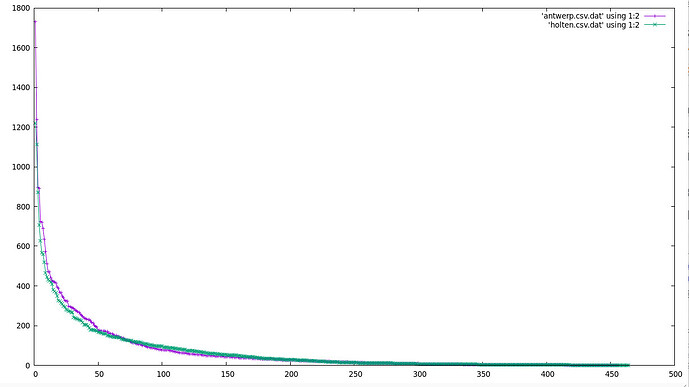
3 (0.6%) most frequent members (I’ll bet one of these is staff) account for 10% of building entries
46 (9%) most frequent members account for 20% of entries
315 (61%) least frequent members made 10% of A^2 entries
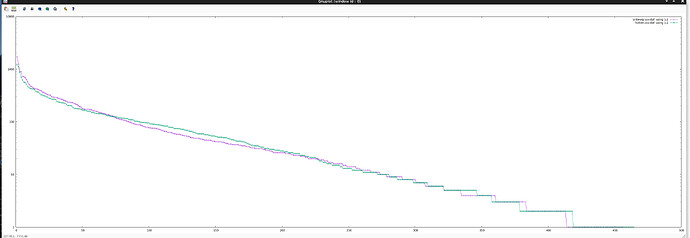
Frequency plot - Holten and Antwerp look remarkably similar
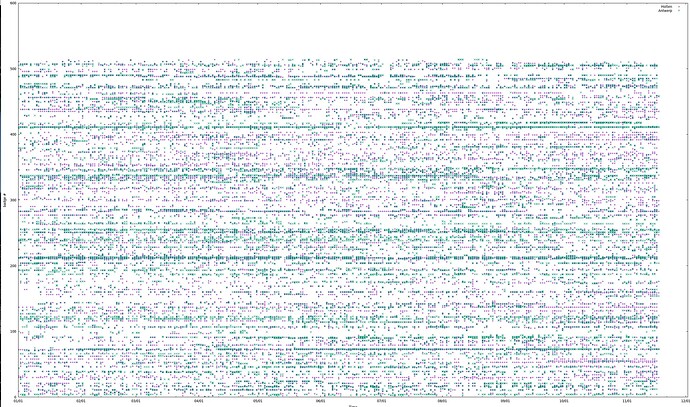
Plot of all badges by date, it’s not hard to see those 9% most frequent badged members, likewise the white spaces.
I’ll run all this again when we get the rest of the data, and when we can x-ref studio renters, 7x24 members, and night/weekend members, there may be some more useful demographics.
We can also pull time-of-day and ay-of-week patterns data in due time.


